Dashboard — metrics row above the donuts STAGING
Narong's red-flagged item (2026-07-24): "Put the Metrics Row Above the Donut Charts." Presentational reorder on the Sales Overview tab — the KPI row moved from the bottom of the tab to the top, so the order is now metrics → donuts → shop performance. One file, no logic, no migration.
Scoped by checking, not guessing. All three dashboard tabs were inspected: only Sales Overview had metrics below its donuts. Today's Summary already renders its KPIs on top, and Sales Behaviors has no metrics row at all — so the change is confined to the one tab flagged.
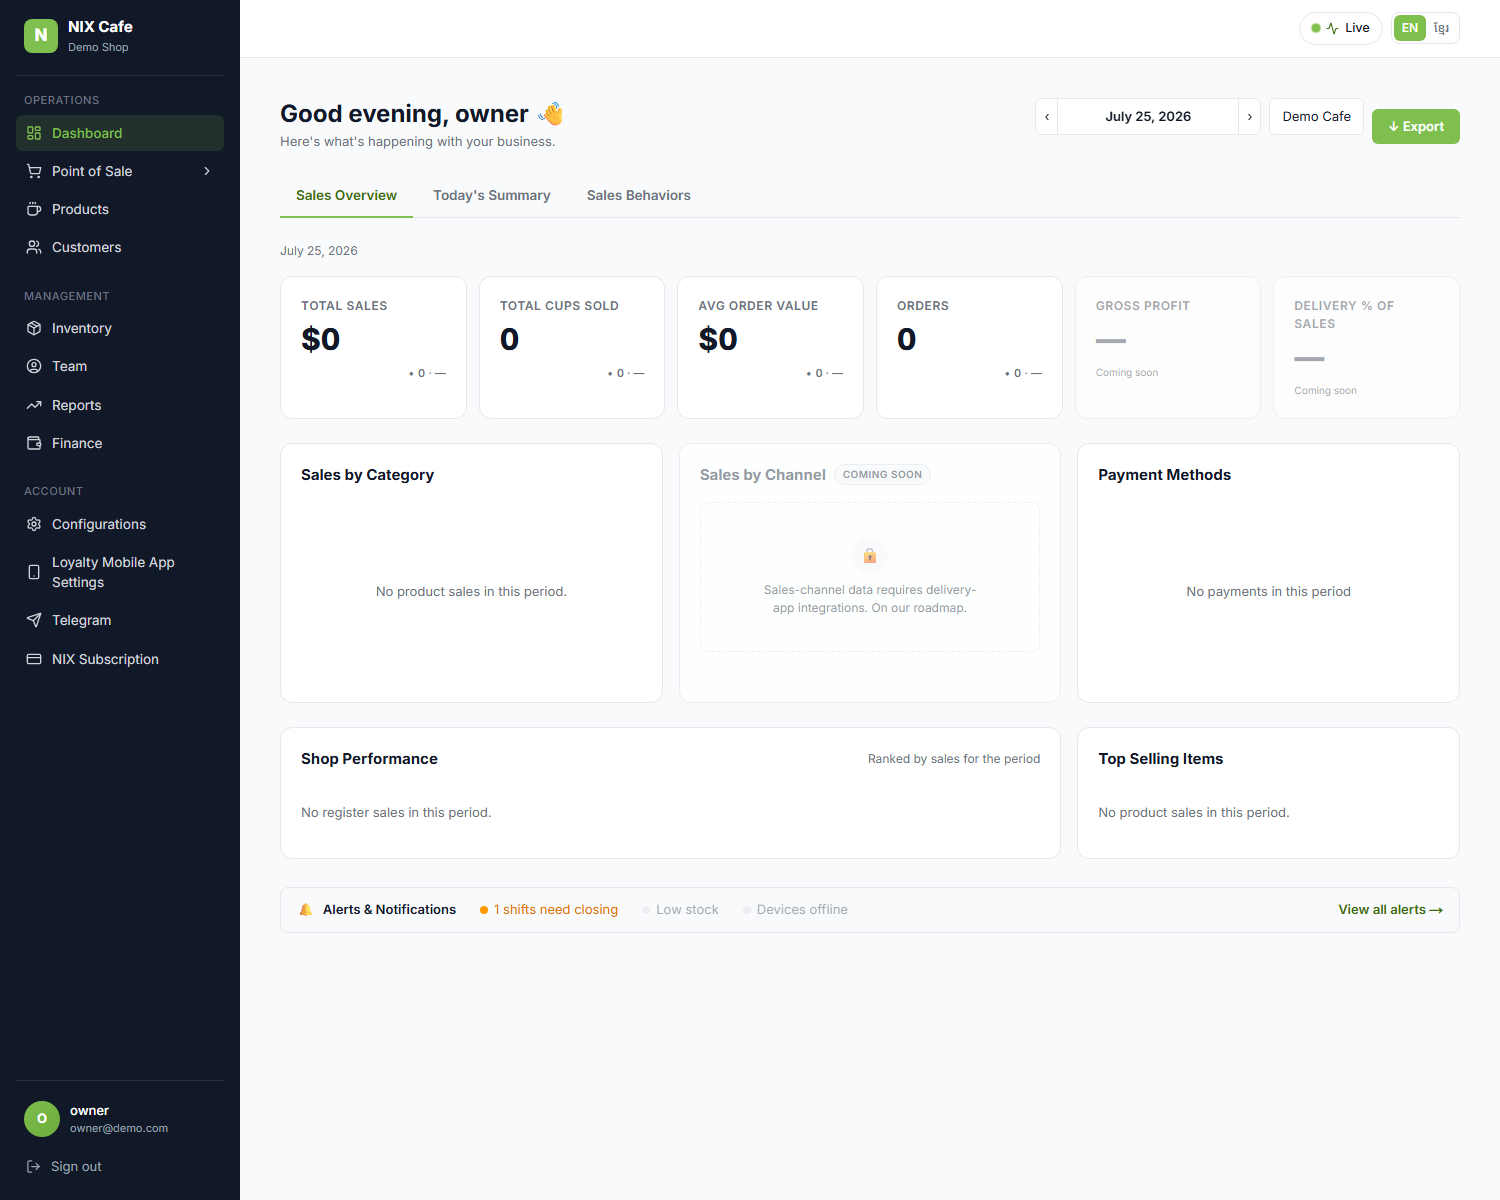
demo.staging. The six metric cards (Total Sales, Cups Sold, Avg Order, Orders,
Gross Profit, Delivery %) now sit directly under the tabs, above the Sales-by-Category / Sales-by-Channel /
Payment-Methods donut cards. Demo has no sales, so the figures are $0 and the donuts are empty — the change is the
order, which is what was asked.
Checks
Staging — metrics row above the donuts, asserted by DOM order (compareDocumentPosition) and geometry (grid top positions), on the deployed Worker | 3/3 |
| Staging smoke (SSO, cross-tenant guard, Starter login, no-session redirect) | 5/5 |
tsc --noEmit | clean |
Two stable grid testids (dashboard-kpis, dashboard-donuts) were added so the order
assertion holds regardless of whether the tenant has data — an empty donut renders a different testid, which is why
a first pass anchored on the chart initially missed.
nix-cafe staging a58d190 (Worker 176fadfd). No migration. Parked for the
scheduled prod promote.